| primitives.svg |
|---|
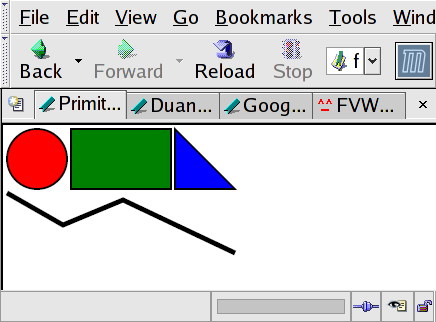
<?xml version="1.0" encoding="UTF-8" standalone="yes"?> <svg xmlns="http://www.w3.org/2000/svg" width="250" height="150"> <title>Primitive SVG Test</title> <circle r="30" cx="34" cy="34" style="fill:red; stroke:black; stroke-width:2"></circle> <rect x="68" y="4" width="100" height="60" style="fill:green; stroke:black; stroke-width:2"></rect> <polygon points="172,4 172,64 232,64" style="fill:blue; stroke:black; stroke-width:2"></polygon> <path d="M 4,68 L 60,100 L 120,75 L 232,128" style="fill:none; stroke:black; stroke-width:5"></path> </svg> |
| html_primitives.html |
|---|
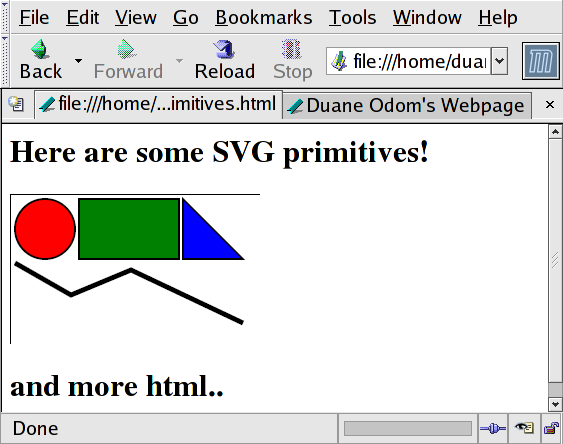
<html> <body> <h1>Here are some SVG primitives!</h1> <embed width="250" height="150" src="primitives.svg" alt="some svg primitives"></embed> <h1>and more html..</h1> </body> </html> |
| tracks.xml |
|---|
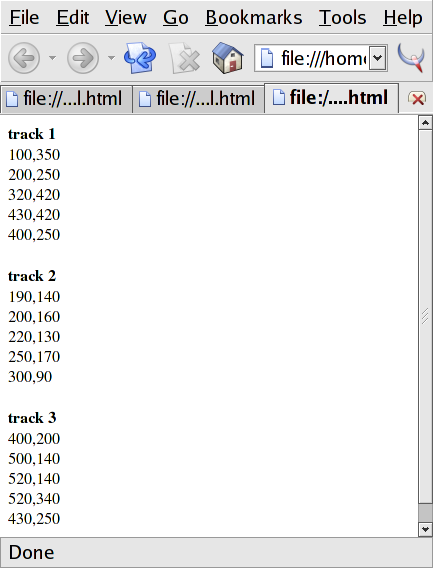
<?xml version="1.0" encoding="utf-8" standalone="yes"?> <tracks> <track id="track 1"> <points> <point x="100" y="350"/> <point x="200" y="250"/> <point x="320" y="420"/> <point x="430" y="420"/> <point x="400" y="250"/> </points> </track> <track id="track 2"> <points> <point x="190" y="140"/> <point x="200" y="160"/> <point x="220" y="130"/> <point x="250" y="170"/> <point x="300" y="90"/> </points> </track> <track id="track 3"> <points> <point x="400" y="200"/> <point x="500" y="140"/> <point x="520" y="140"/> <point x="520" y="340"/> <point x="430" y="250"/> </points> </track> </tracks> |
| tracks.xsl |
|---|
<?xml version="1.0"?> <xsl:stylesheet version="1.0" xmlns:xsl="http://www.w3.org/1999/XSL/Transform"> <xsl:output method="html" indent="yes" encoding="UTF-8"/> <xsl:template match="/"> <html> <body> <xsl:for-each select="tracks/track"> <b><xsl:value-of select="@id"/></b><br/> <xsl:for-each select="points/point"> <xsl:value-of select="@x"/>,<xsl:value-of select="@y"/><br/> </xsl:for-each> <br/> </xsl:for-each> </body> </html> </xsl:template> </xsl:stylesheet> |
| simple_overlay.svg |
|---|
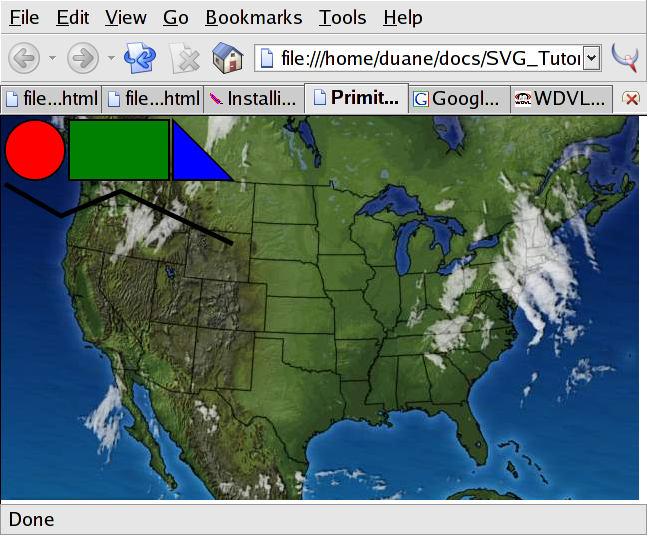
<?xml version="1.0" encoding="UTF-8" standalone="yes"?> <svg xmlns="http://www.w3.org/2000/svg" xmlns:xlink="http://www.w3.org/1999/xlink" width="638" height="384"> <title>Primitive SVG Test</title> <image xlink:href="map.png" x="0" y="0" width="638" height="384"/> <circle r="30" cx="34" cy="34" style="fill:red; stroke:black; stroke-width:2"></circle> <rect x="68" y="4" width="100" height="60" style="fill:green; stroke:black; stroke-width:2"></rect> <polygon points="172,4 172,64 232,64" style="fill:blue; stroke:black; stroke-width:2"></polygon> <path d="M 4,68 L 60,100 L 120,75 L 232,128" style="fill:none; stroke:black; stroke-width:5"></path> </svg> |
| final.html |
|---|
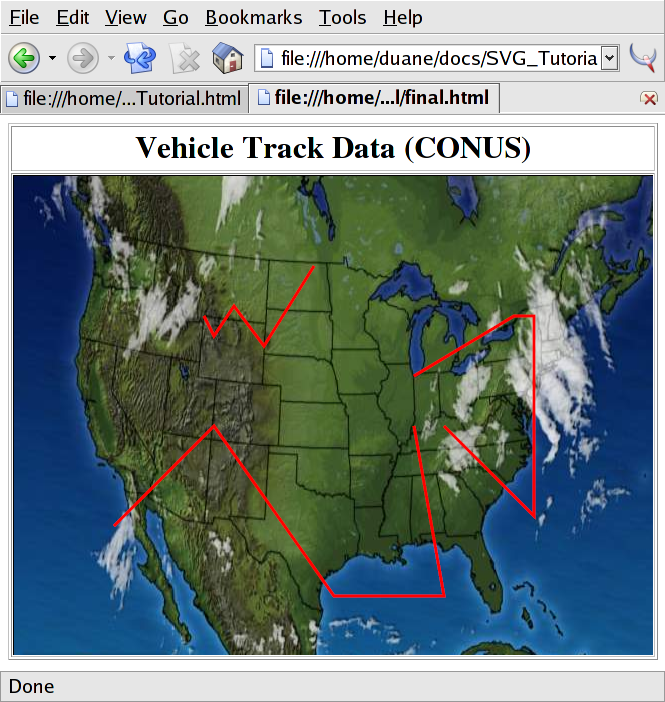
<html> <body> <table border=1> <th><h1>Vehicle Track Data (CONUS)</h1></th> <tr><td><embed width="640" height="480" src="final.svg" alt="vehicle track data overlaid onto OCONUS map.."></embed></td></tr> </table> </body> </html> |
| final.xsl |
|---|
<?xml version="1.0" encoding="UTF-8" standalone="yes"?> <xsl:stylesheet version="1.0" xmlns:xsl="http://www.w3.org/1999/XSL/Transform"> <xsl:output method="xml" media-type="image/svg" indent="yes" encoding="UTF-8"/> <xsl:template match="/"> <svg xmlns="http://www.w3.org/2000/svg" xmlns:xlink="http://www.w3.org/1999/xlink" width="640" height="480"> <image xlink:href="map.png" x="0" y="0" width="640" height="480"/> <xsl:for-each select="tracks/track"> <polyline> <xsl:attribute name="style"> <xsl:text>fill:none; stroke:red; stroke-width:3</xsl:text> </xsl:attribute> <xsl:attribute name="points"> <xsl:for-each select="points/point"> <xsl:value-of select="@x"/> <xsl:text>,</xsl:text> <xsl:value-of select="@y"/> <xsl:text> </xsl:text> </xsl:for-each> </xsl:attribute> </polyline> </xsl:for-each> </svg> </xsl:template> </xsl:stylesheet> |
| tracks.xml |
|---|
<?xml version="1.0" encoding="utf-8" standalone="yes"?> <tracks> <track id="track 1"> <points> <point x="100" y="350"/> <point x="200" y="250"/> <point x="320" y="420"/> <point x="430" y="420"/> <point x="400" y="250"/> </points> </track> <track id="track 2"> <points> <point x="190" y="140"/> <point x="200" y="160"/> <point x="220" y="130"/> <point x="250" y="170"/> <point x="300" y="90"/> </points> </track> <track id="track 3"> <points> <point x="400" y="200"/> <point x="500" y="140"/> <point x="520" y="140"/> <point x="520" y="340"/> <point x="430" y="250"/> </points> </track> </tracks> |